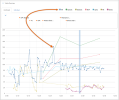
Trending Vitals - Vitals Overview Section
Note: Click tiny figures to enlarge.
In Release 12.12, we are rolling out Trending Vitals on the Playback page for all cloud environments. Trending Vitals will allow you to better visualize the patient vitals in cases that come from both the X Series and R Series monitor defibrillators.
Benefits: Trending Vitals provides the following benefits:
-
Track each individual vital over time and create a trend line
-
Improve annotations so you can focus on specific areas of the case
-
Spot relationships with vitals in a case
-
Help visualize moments of clinical importance
-
Provide a visual on the impact of clinical interventions
-
Identify areas of interest for post case analysis for training, compliance, and QCI efforts
Vitals by value: Trending Vitals displays the following vitals:
-
Heart Rate (HR)
-
Respiratory Rate (breaths per minute (bpm))
-
EtCO2 (mmHg)
-
Sp02 (%)
-
Systolic Blood Pressure(mmHg)
-
Diastolic Blood Pressure (mmgHg)
-
Mean Atrial Pressure (mmHg)
Review of the existing Vitals section
The current Vitals section on the Playback page employs a "speed dial" to highlight a specific point in time in the case corresponding to where a user clicked on the timeline. The functionality of this section remains unchanged, displaying Pulse Rate, Respiratory Rate, EtCO2, SpO2, and NIBP.
The Vitals section looks like this when collapsed:

And like this when expanded:
The "Show more vitals" link can be used to display Temp1, Temp2, Delta, IBP P1/P2/P3, FiCO2, SpMet, SpCO, SpOC, SpHB, PVI, PI, Pacing, and CPR.
Vitals Overview
The new Vitals Overview section displays above the existing Vitals section and has two tabs, Combined, and Individual.
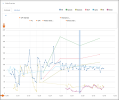
The timelines and charts on the Playback page are synchronized. Click on a place within the "Event timeline", "ECG overview", "ECG editor", "Vitals Overview" > Combined tab, or any vital displayed on the "Vitals Overview" > Individual tab to synchronize the location within the case across all entities. In each vitals chart, a blue bar displays which indicates where you are in the case. The bar corresponds to a 10-second view on all charts.
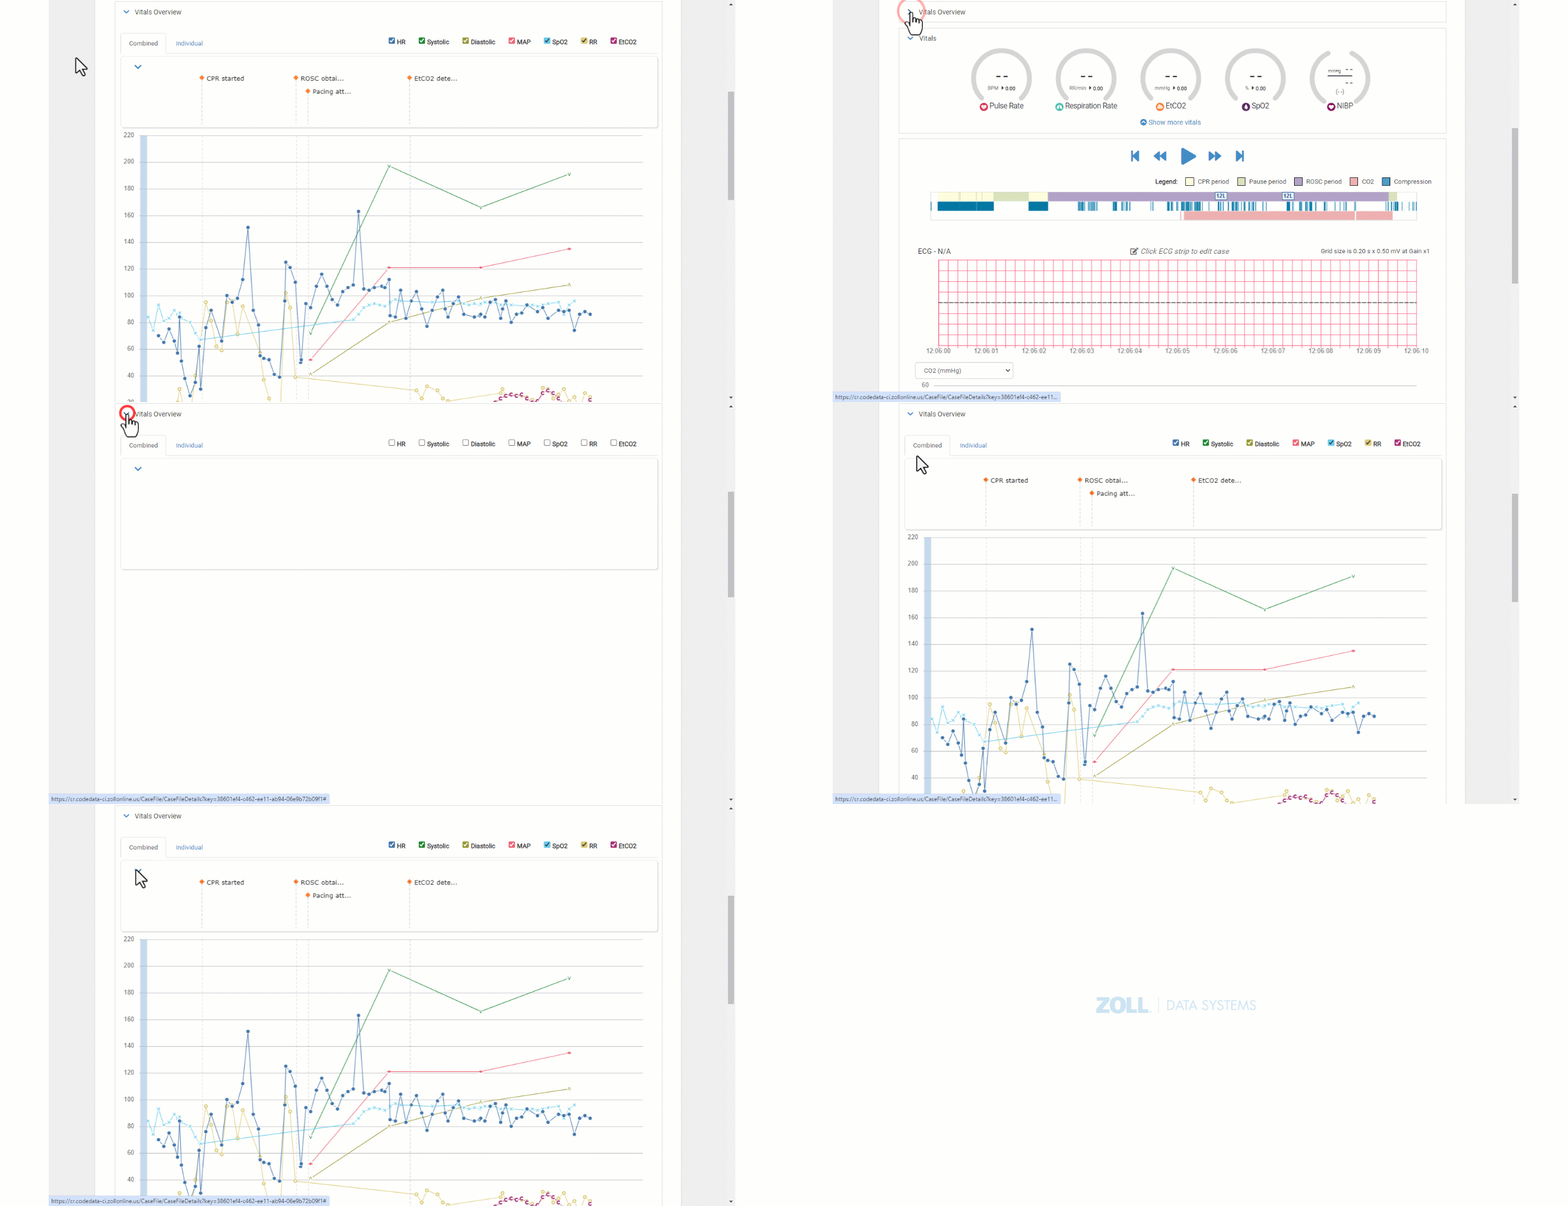
Collapse the Vitals Overview section
The Vitals Overview section can be collapsed and expanded by clicking the chevron to the left of the heading. If you collapse or expand Vitals Overview, go to another tab or case and then return to the Playback page, the system will remember your setting.
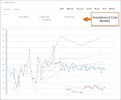
Code markers and annotations
Note: The icon for annotations prior to 12.12 looked like a red box with the letter "A" inside. The icon has changed to an orange diamond. The icon for the code markers derived from the X and R Series devices are still represented by a red circle.
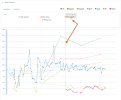
Because annotations and code markers are important, they have their own space at the top of the charts on both the Combined and Individual tabs where they display. To ensure that each annotation can be clearly seen with no overlapping, each annotation has its own row and will display vertically. Code markers display horizontally under the individual annotation rows. Dotted lines that correspond with each annotation and code marker flow down the chart to enable you to easily see where they occurred.
Labels are limited to 10 characters. Hovering on an annotation or code marker displays the full text (50 characters maximum). The annotation or code marker highlights orange when clicked along with its associated dotted line.
This annotations/code marker section can be collapsed and expanded by clicking the chevron to the left. The collapsed view reduces the annotations to just the icons, however you can still see the full text by hovering over the marker with your mouse.

As a reminder, you can add, edit, and remove an annotation in the ECG chart.
Combined
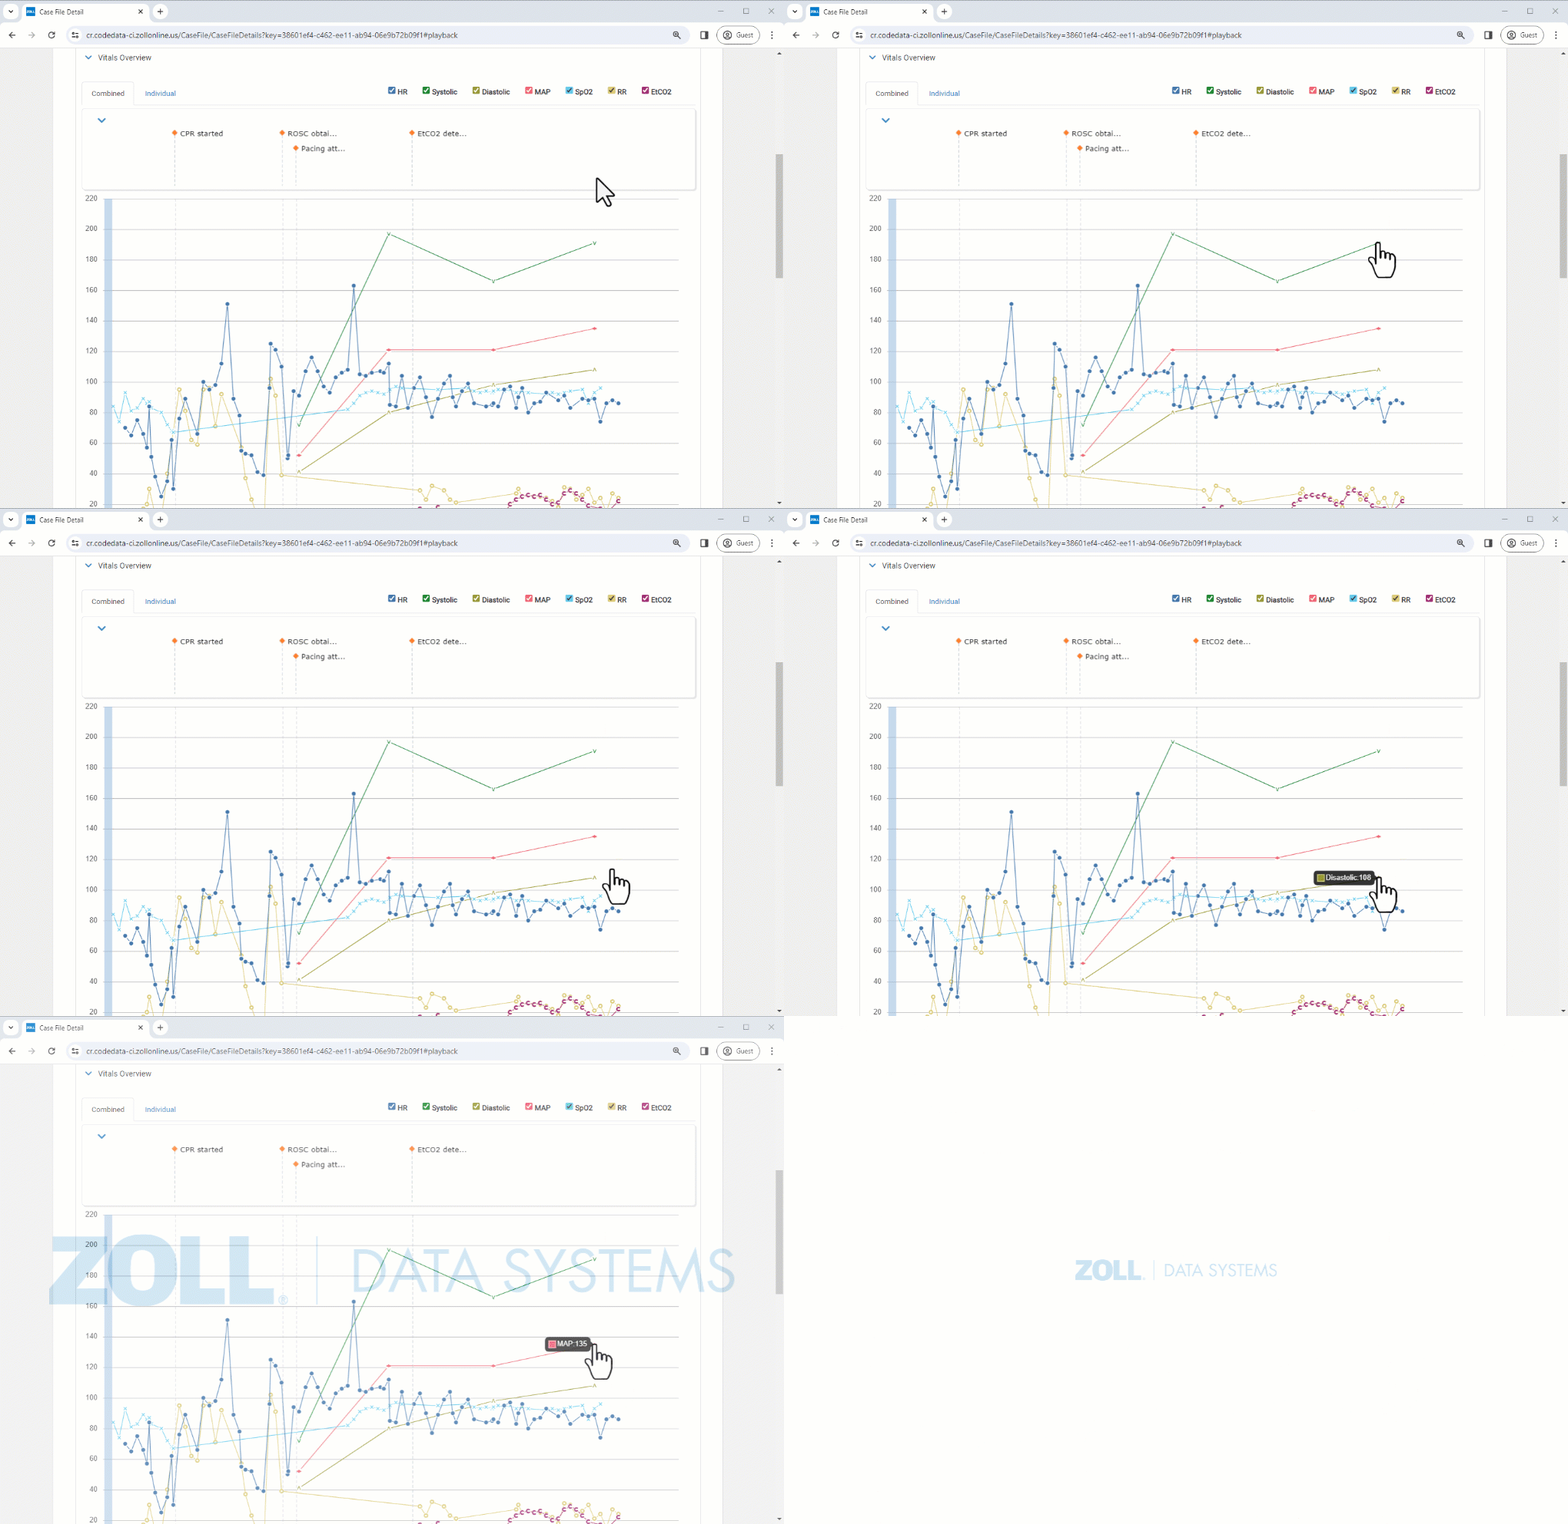
The Combined tab shows all vitals that were obtained by the device on a single chart. The entire case time displays on the bottom X-axis. The value scale displays on the Y-axis. Trend lines are drawn between the data points.
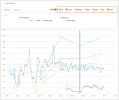
Checkboxes for Heart Rate (HR), Systolic Blood Pressure, Diastolic Blood Pressure, Mean Atrial Pressure (MAP), SpO2, Respiratory Rate (RR), and EtCO2 display at the top. Select or deselect a checkbox to display or hide the trend of that vital on the chart. Use this functionality to focus on specific vitals relevant to a patient's condition at any point in the case. Additionally, hover over any vital data point to retrieve specific information about that particular vital.
Note: If the vital is not in the case, they will still appear in the list but their associated box will be gray and unselectable.

For easy identification, each vital is color coded, the line color matches the checkbox color.
Use your mouse to hover over a vital point to view the value at that point in time.
Individual
The individual tab shows the vitals broken out in individual charts. This view will be helpful when isolating a vital and removing unneeded vitals from view. While the X-axis continues to represent the entire case time, the Y-axis is automatically scaled to depict the highest and lowest values for that particular vital in the case. For certain vitals, a 10% buffer is applied above and below the highest/lowest vital value on the Y-axis to enhance visibility.
As in the Combined tab, checkboxes at the top can be used to view/hide each vital. In the Individual tab, unchecking a vital removes the chart from view.
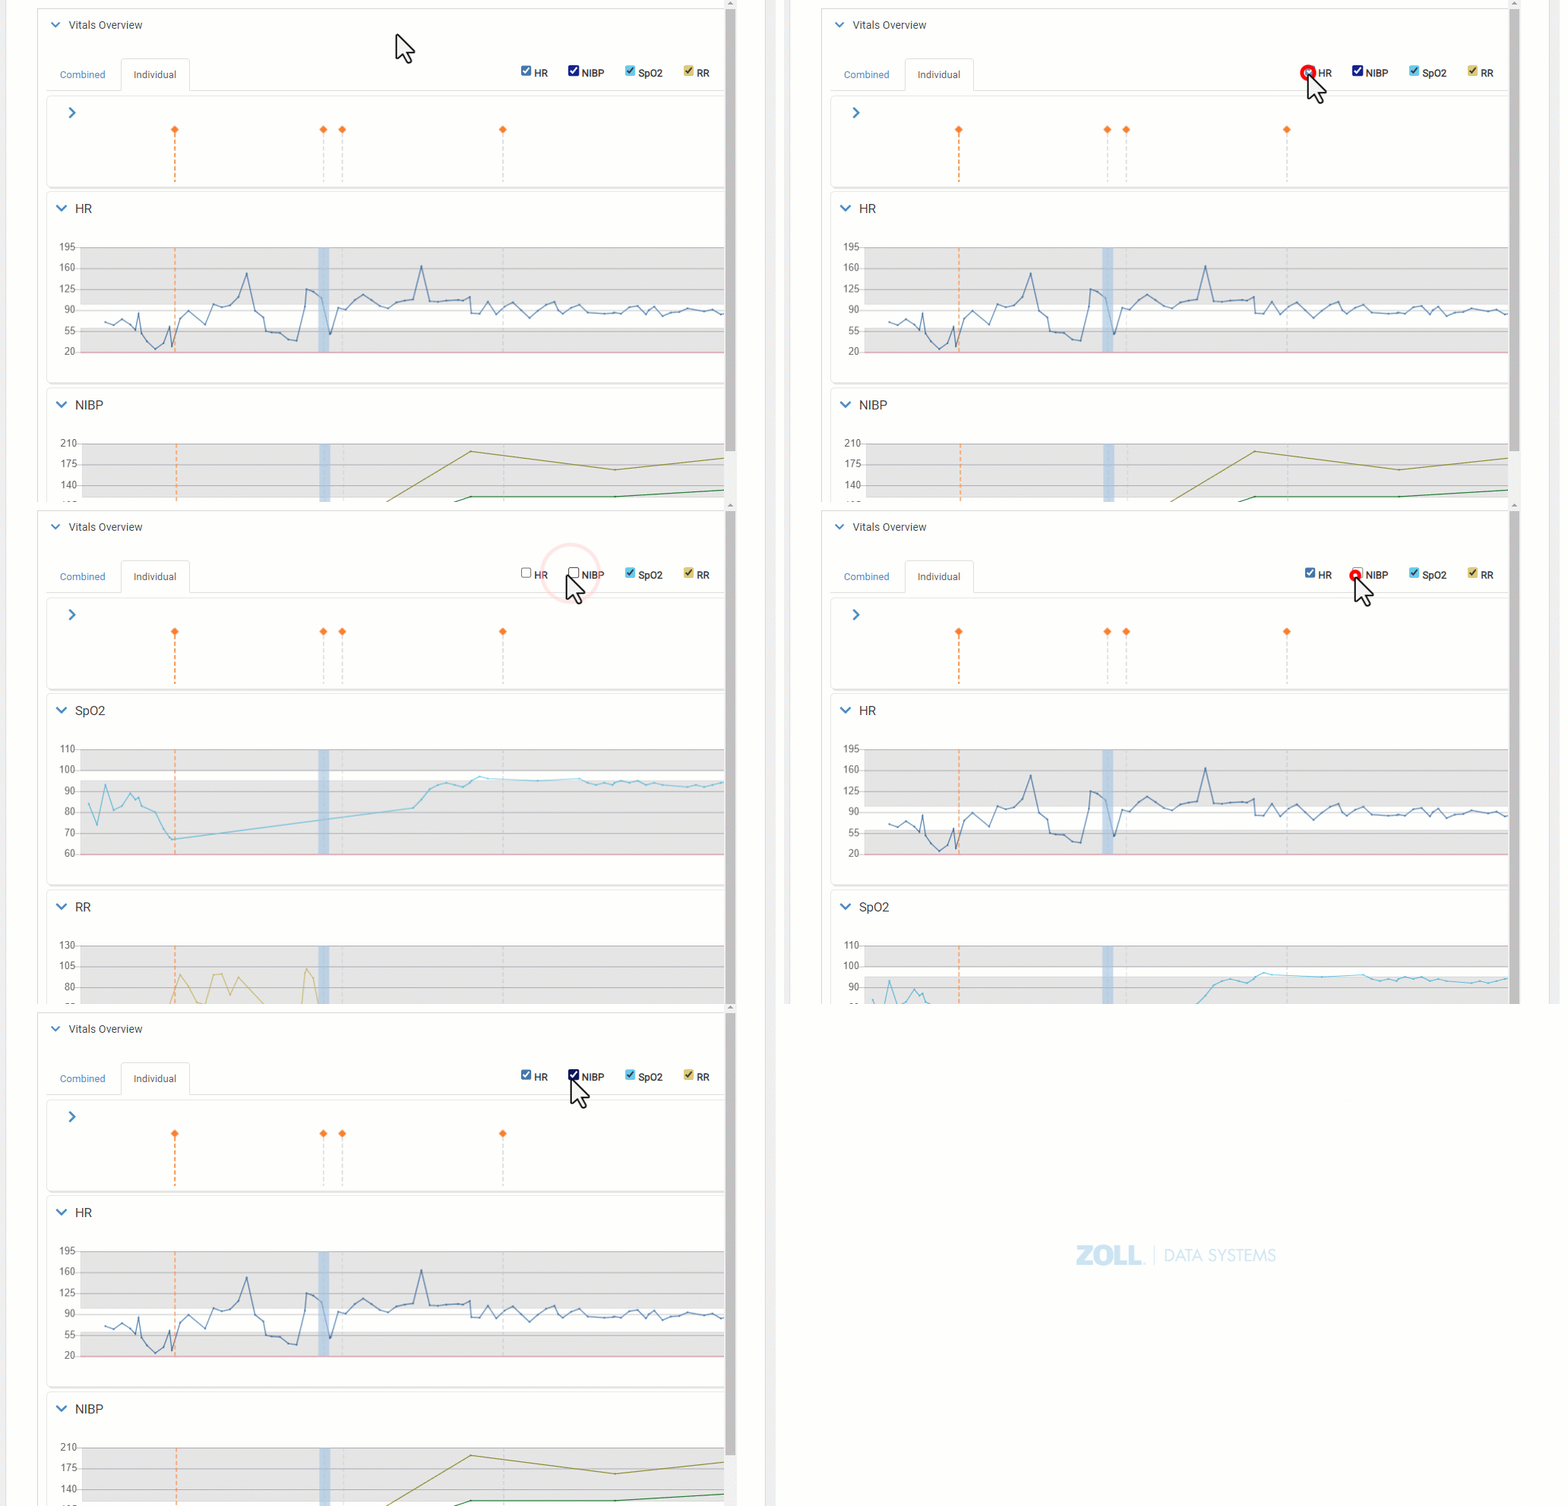
Also, you can expand or collapse each chart by clicking the chevron on the left side. If you collapse or expand a vital chart, go to another tab or case and then return to the Playback page, the system will remember your setting and display the vital in the condition you left it in (expanded or collapsed).
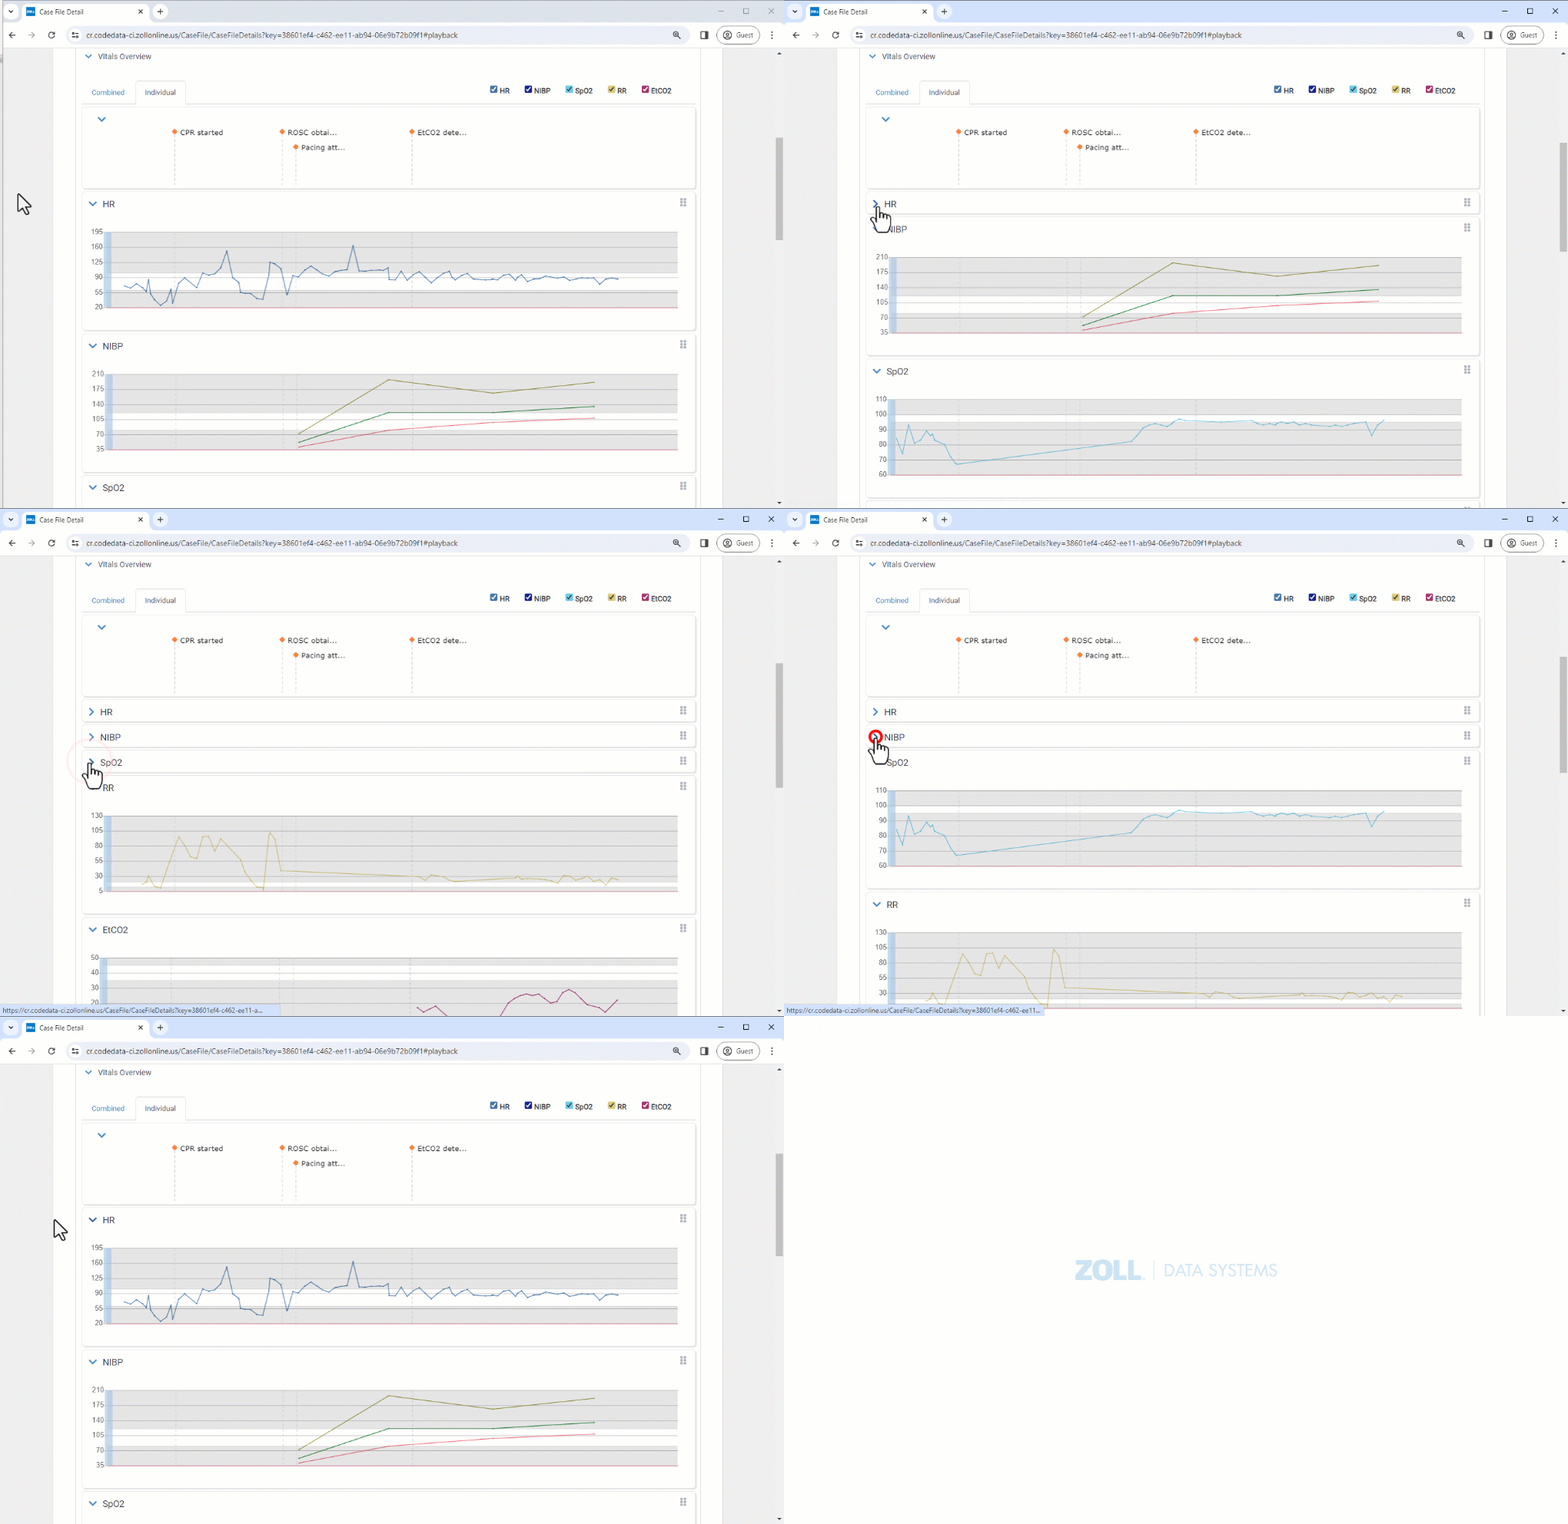
Rearrange the chart order by hovering over the gripper icon (six dots), then dragging and dropping the chart to a different location.
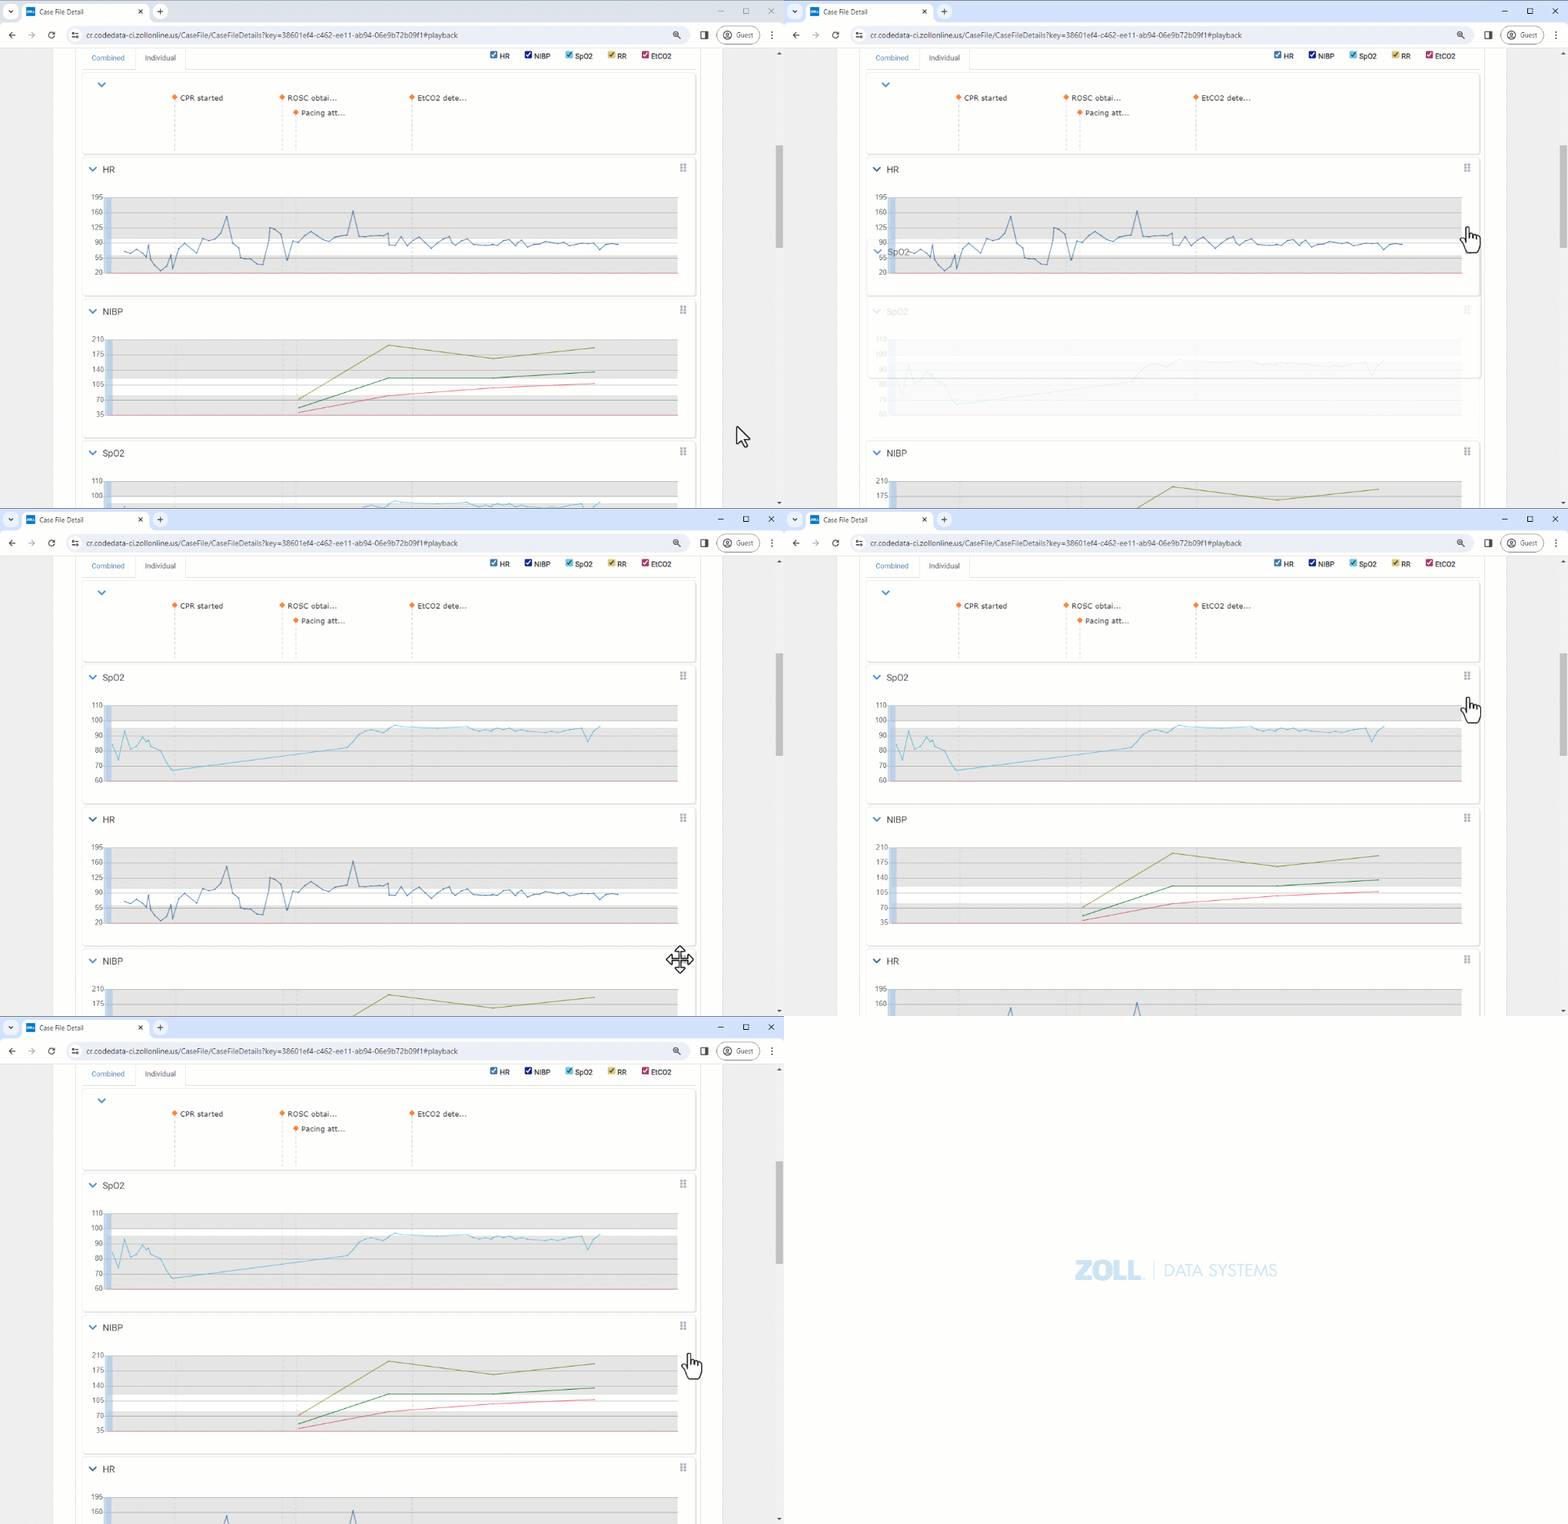
The Y-axis auto scales to allow you to see the entire trend of a single vital and when it extends beyond its normal target range highlighted by a blue horizontal bar. Annotations and code markers are present on each vital at their respective timestamps.


